
Barcelona in numbers: crimes, victims and safety
- Open data
- Urban visions
- Apr 19
- 3 mins


Barcelona residents rate safety in the city with a score of 6.2 and give high marks to the police force, according to the latest victimisation survey. Victims of crimes have risen almost five points over the last five years, to 25.6%, and the perception that safety has worsened has grown by almost seven points (24.3% in 2018). Residents feel less safe due to rising crime (31.5%), followed by the lesser presence of security forces (9.7%).
Global victimisation index
Barcelona City Council’s Victimisation Survey asks residents how they perceive the level of safety in the city and the crimes from which they have suffered. One in four people surveyed had been the victim of a crime during 2017. The figures collected over 34 years indicate that we are returning to the levels of the 1980s. The 1990s were when residents felt safest.
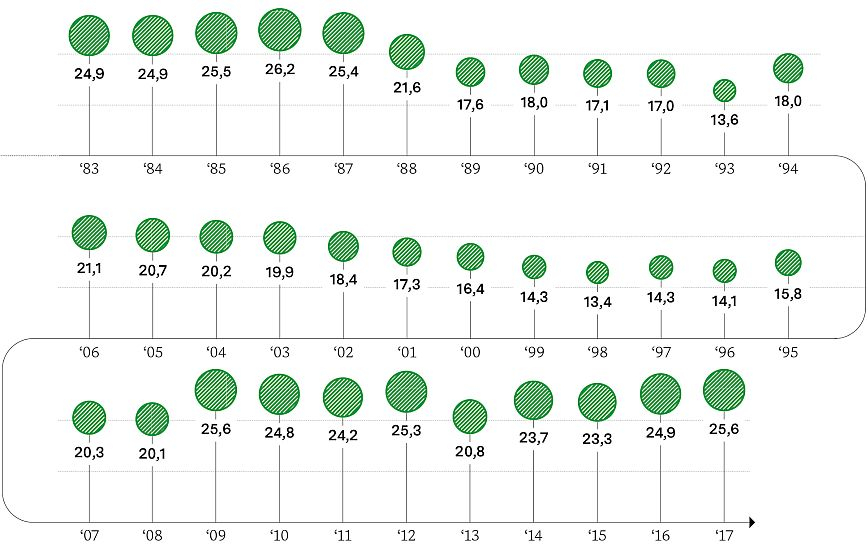 INDEX OF VICTIMISATION ACCORDING TO CRIMES COMMITTED (2013-2017)
Source: Barcelona City Council’s Victimisation Survey 2018.
 INDEX OF VICTIMISATION ACCORDING TO CRIMES COMMITTED (2013-2017)
Source: Barcelona City Council’s Victimisation Survey 2018.
Crimes or attempted crimes?
Criminals do not always succeed in committing their crimes. In 20.3% of the cases, the crime actually took place, while in 11.2% it was only attempted. In 2017, according to the survey, 54 crimes were committed per 100 inhabitants, but only 25.6% of Barcelona residents said that they had suffered from one or more crimes. This shows that the victims suffered from 2.1 crimes on average.
The scenes of the crimes
The sphere where the most crimes are committed, according to the survey respondents, is that of personal safety, which has risen from 12.1% to 18.5% in the last five years. However, attacks on businesses did not even top 1%. The numbers by sex show similar levels of victimisation, although women said they suffered more attacks on their personal safety (20.1%) than men (16.8%). Meanwhile, men said they suffered from more crimes against their vehicle (9.6%), nearly double the rate of women (5.2%).
 INDEX OF VICTIMISATION PER SPHERE ACCORDING TO SEX (2017)
Source: Barcelona City Council’s Victimisation Survey 2018.
 INDEX OF VICTIMISATION AND INDEX OF RISK PER SPHERE (2013-2017)
Source: Barcelona City Council’s Victimisation Survey 2018.
Personal safety
One in five crimes declared by the respondents were against their personal safety, including different types, or theft, intimidation, threats, robbery or physical and sexual aggression. The most frequent type of attack against personal safety was the theft or attempted theft of the victim’s bag or wallet. Since 2017, the Victimisation Survey has explicitly asked about sexual aggression or attempted sexual assault, differentiating them from other types of physical assault. In this case, the incidence difference by sex is remarkable: only one in 10 cases of aggression or attempted aggression was suffered by a man.
 VICTIMISATION IN CRIMES AGAINST PERSONAL SAFETY (2017)
 Source: Barcelona City Council’s Victimisation Survey 2018.
Open public spaces are where the most crimes against safety occur. Almost one in two crimes or attempts took place in an open public space (43.9%), followed by public transport (30.3%). Businesses suffered from 12% of all crimes and crimes committed at home accounted for 4.6%. More crimes or attempts were committed in busy streets (21.5%) than in streets with few people (9.9%).
 WHERE CRIMES AGAINST PERSONAL SAFETY TAKE PLACE (2017)
Source: Barcelona City Council’s Victimisation Survey 2018.
Crimes and victims in the districts
Broken down by district, the victims and crimes were mostly concentrated in Ciutat Vella, which reported more than 10 points of difference compared to the average for Barcelona. Moreover, there were 122 crimes per 100 inhabitants in this district.
 INDEX OF VICTIMISATION BY DISTRICT (2017)
Source: Barcelona City Council’s Victimisation Survey 2018.
 PROPORTION OF SCENES BY DISTRICT (2017)
Source: Barcelona City Council’s Victimisation Survey 2018.
Reporting crime
The percentage of people who reported crimes has remained stable in recent years and sat at 22.4% in 2017. The most commonly reported crimes were robberies (37.9%). The top reasons why victims did not report crimes were their belief that the police cannot do much about them, the complicated process of filing a report and a lack of trust in the criminal justice system. However, the respondents saw the police and security forces in a positive light, rating the Mossos d’Esquadra police force with a score of 7.1 and the Guàrdia Urbana police force with a score of 6.6.
 INDEX OF CRIMES REPORTED (2013-2017)
Source: Barcelona City Council’s Victimisation Survey 2018.
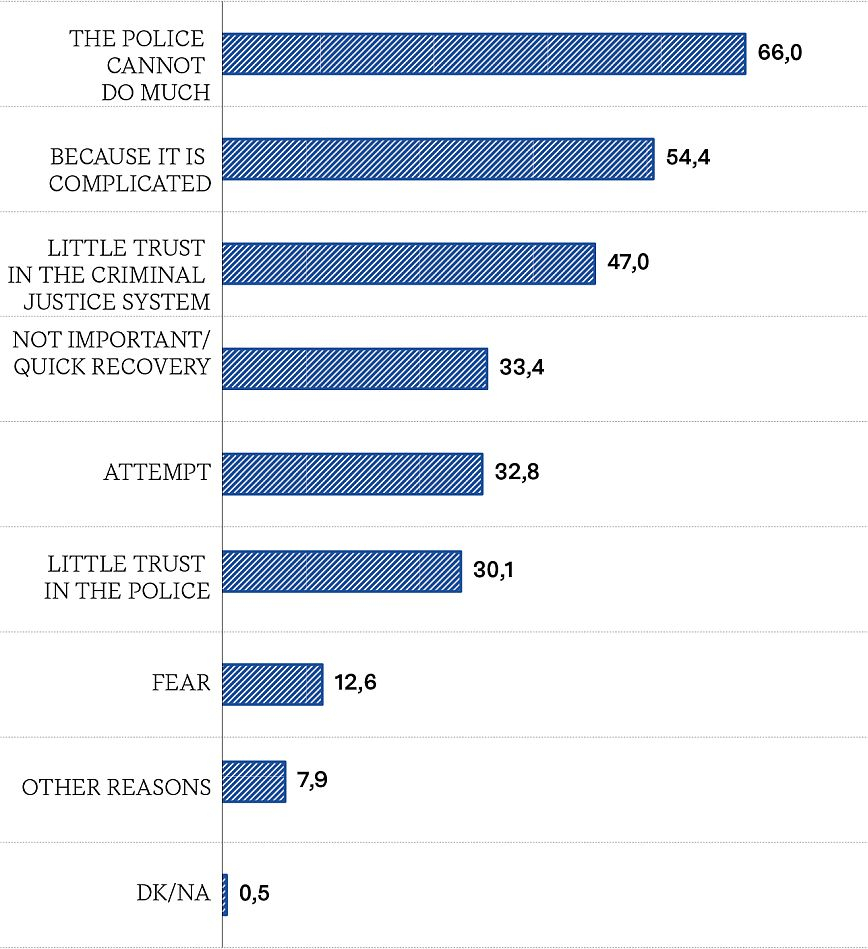 REASONS FOR NOT REPORTING CRIMES (2017)
Source: Barcelona City Council’s Victimisation Survey 2018.
 INDEX OF CRIMES REPORTED PER CRIME (2017)
Source: Barcelona City Council’s Victimisation Survey 2018.

The newsletter
Subscribe to our newsletter to keep up to date with Barcelona Metròpolis' new developments