Some of the specific measures have started to be implemented following the approval of the Climate Plan for 2018-2030 on 26 October and the Climate Emergency Declaration on 15 January 2020, and these will be monitored. The goal is to continue promoting the measures that have been effective while correcting and predicting the continuation of other measures that fail to work.

The following actions are being taken for an assessment of the progress being made in the measures implemented for tackling the climate emergency in the city:
- Periodic monitoring of the measures in accordance with the changing reality and the city's reality
- Monitoring of the strategic goals of the Climate Plan and Climate Emergency Declaration with regard to energy consumption, greenhouse-gas emissions, ecomobility, generation of energy from renewable sources, the sources of the Council’s funding, water consumption and so on.
- Monitoring of the indicators identified in each line of action, according to not just the context but also the impact and implementation of the measures.
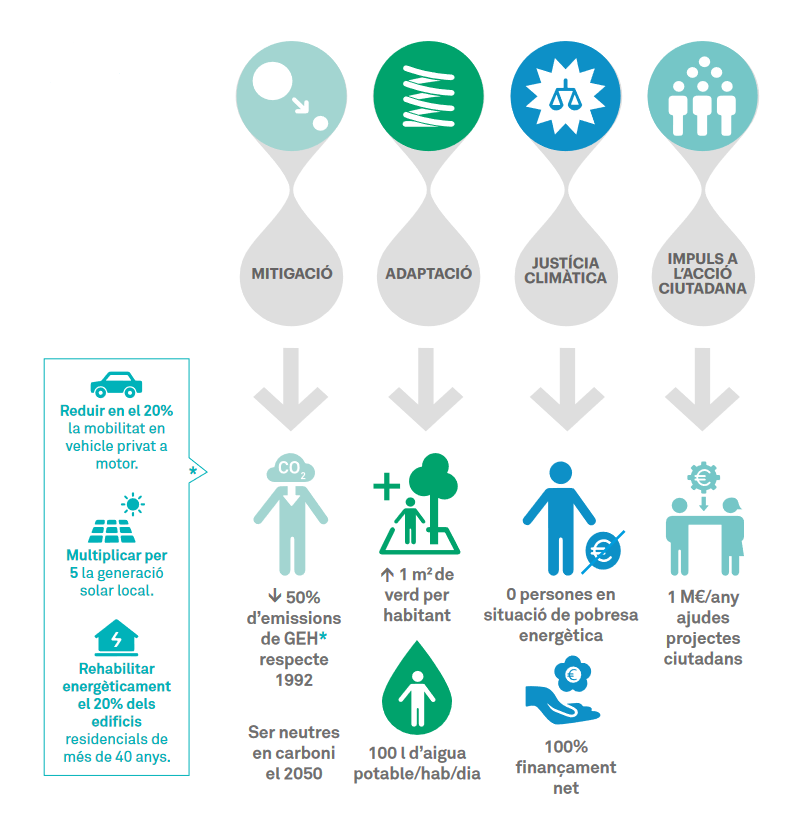
As for the city’s main goals for taking on climate change, the results from November 2020 are as follows:
Objective 2030 | Current situation |
---|---|
Reduce per capita GHG emissions by 50% compared to 1992 (3.14 t CO2/hab.): | 2017: 3,413,260 tonnes of CO2-e, a figure representing a 28% reduction. |
Reduce private motor vehicle journeys by 20%. In 2014, 2.014 billion private transport journeys were made (26,2% of the total 7.833 billion journeys made). | 2017: 2,1 billion private transport journeys made (25,57% of the total), a reduction of 0.024% compared to 2014. |
Increase solar power generation fivefold. In 2014, 97,3% GWh were generated. | 2017: 100,84 GWh of solar generation. Up to now, it has multiplied by 1.036. |
Renovate, in energy terms, 20% of residential buildings that are over 40 years old. | 2017: 425 energy improvement interventions in residential buildings, which is 5,25% of redisential buildings over 40 years old. |
Increase urban green space by 1.6 km2. 2016 is being used as the reference year, when there were 28.27 km2. The aim is to reach a figure of 1m2 more of green space per current inhabitant, which is 29,87m2. |
|
Obtain 100% clean funding. | 2018: 100% of funding requested is clean. The accumulated debt, however, is not 100% clean, as previously it did not meet the current requirements of local, ethical banking. |
Achieve domestic potable water consumption of under 100 l/inhabitant/day. In 2014, 107,5l/inhabitant/day were consumed. | 2017: 108,26 l/inhabitant/day. 2018: 106,98 l/inhabitant/day. |
Have zero energy poverty. In 2016, 10,6% of Barcelona's citizens experienced energy poverty (69.500 households). | This indicator will be updated in 2021. At risk of poverty or social exclusion (AROPE) rate: 2016: 15,8% 2017: 15,3% |
Provide financial aid to the tune of 1 million euros a year for implementing projects that help to tackle the climate emergency. | 2018: €200.000 in subsidies for 11 collaborative citizen projects. 2020: €200,000 for a new call for subsidy applications (in progress) |
The initial indicators were calculated at the start of the Climate Plan and Climate Emergency Declaration, and are measured and reported annually through the official platforms (Carbon Disclosure Project). In addition, monitoring information is also being periodically offered, for the purposes not just of accounting to citizens for the work carried out but also of complying with the Global Covenant of Mayors for Climate & Energy.
Presentation day events are being held for these reports to carry out a joint assessment with citizens and other players involved, as well as a monitoring of the implementation of collaborative projects driven by citizen action.
The Climate Plan and Climate Emergency Declaration have short-, medium- and long-term goals. Monitoring of the milestones and implementation of the plan will be carried out manually using reports that measure the degree of fulfilment of the objectives. In this sense, this is a dynamic plan, because it will be periodically updated and programmed in line with these results.